
Performance
PERFORMANCE
A regular performance over 30 years
The Group was fully mobilized to serve its customers and patients in 2020, which was an out of the ordinary year. The Group’s performance was outstanding in this environment: sales resilience, significant margin improvement, net profit growth and investment decisions continued at a very high level. This performance illustrates the solidity of our business model.
EVOLUTION OF GROUP REVENUE
over 30 years (in millions of euros)
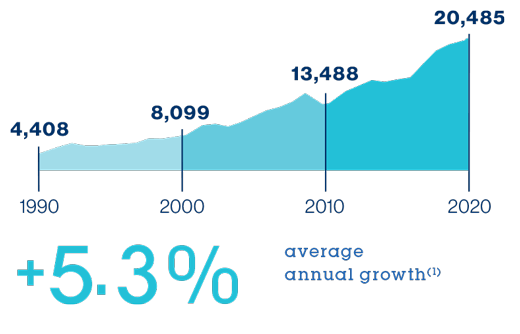
- 1990: 4,408
- 2000: 8,099
- 2010: 13,488
- 2020: 20,485
+5.3%
average annual growth(1)
EVOLUTION OF ADJUSTED NET EARNINGS(2) PER SHARE
over 30 years (in euros)
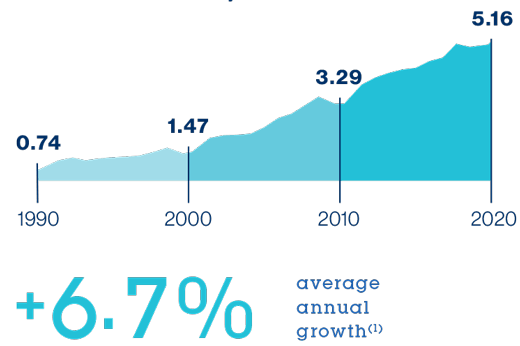
- 1990: 0.74
- 2000: 1.47
- 2010: 3.29
- 2020: 5.16
+6.7%
average annual growth(1)
EVOLUTION OF ADJUSTED DIVIDEND(2) PER SHARE
over 30 years (in euros)
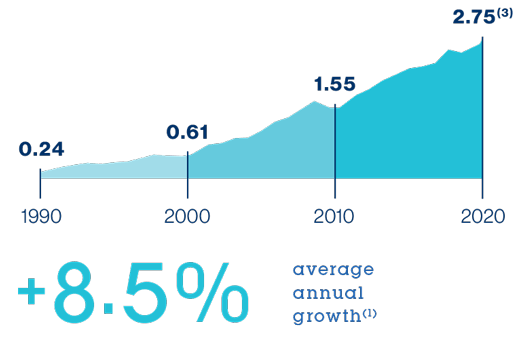
- 1990: 0.24
- 2000: 0.61
- 2010: 1.55
- 2020: 2,75
+8.5%
average annual growth(1)
2020 key financial figures
REVENUE
€20,485 M
NET PROFIT (Group share)
€2,435 M +1.5%(4)
OIR MARGIN
18.5% +80pbs(5)
EFFICIENCY GAINS
€441 M
EARING
55.8%
INVESTMENT DECISIONS
€3.2 bn
2020 key extra-financial figures
SAFETY
0.9
Frequency rate of accidents with time off work per million hours worked. This is the lowest frequency rate of the last 20 years.
CARBON INTENSITY(6)
-30%
Reduction in carbon intensity over the past five years, in line with the target set for 2025
DIVERSITY
30%
of women among Engineers and Professionals