
Consistent performance
over 30 years
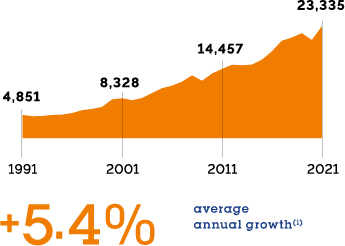
EVOLUTION OF GROUP REVENUE
over 30 years (in millions of euros)
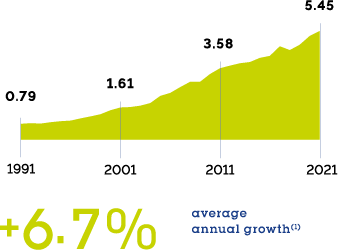
EVOLUTION OF ADJUSTED NET EARNINGS(2) PER SHARE
over 30 years (in euros)
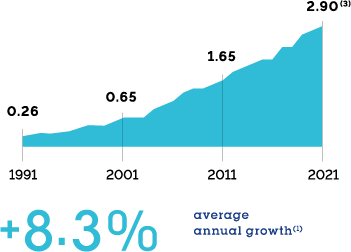
EVOLUTION OF ADJUSTED DIVIDEND(2) PER SHARE
over 30 years (in euros)
2021 key
financial figures
REVENUE
€23,335M
+8.2%(4)
RECURRING NET PROFIT
(Group share)
€2,572M
+13.3%(5)
OPERATIONAL MARGIN
17.8%
+70 bps(6)
EFFICIENCY GAINS
€430M
GEARING
47.5%
INVESTMENT DECISIONS
€3.6bn
- Calculated according to prevailing rules over 30 years.
- Adjusted for the 2-for-1 share split in 2007, for attributions of free shares and for a factor of 0.974 reflecting the value of the rights of the capital increase completed in October 2016.
- 2021 dividend subject to the approval of shareholders at the General Meeting on May 4, 2022.
- Comparable growth, excluding currency and energy effects.
- Excluding exceptional and significant operations not impacting operating income recurring.
- Excluding energy impact.
Innovation
- €304M
of innovation expenses including 100 million dedicated to the energy transition - 354
new patents filed - >400
industrial and scientific partnerships and collaborations with start-ups